Cochrane Real Estate Stats
Curious how the real estate scene unfolded in your Cochrane neighbourhood in 2023?

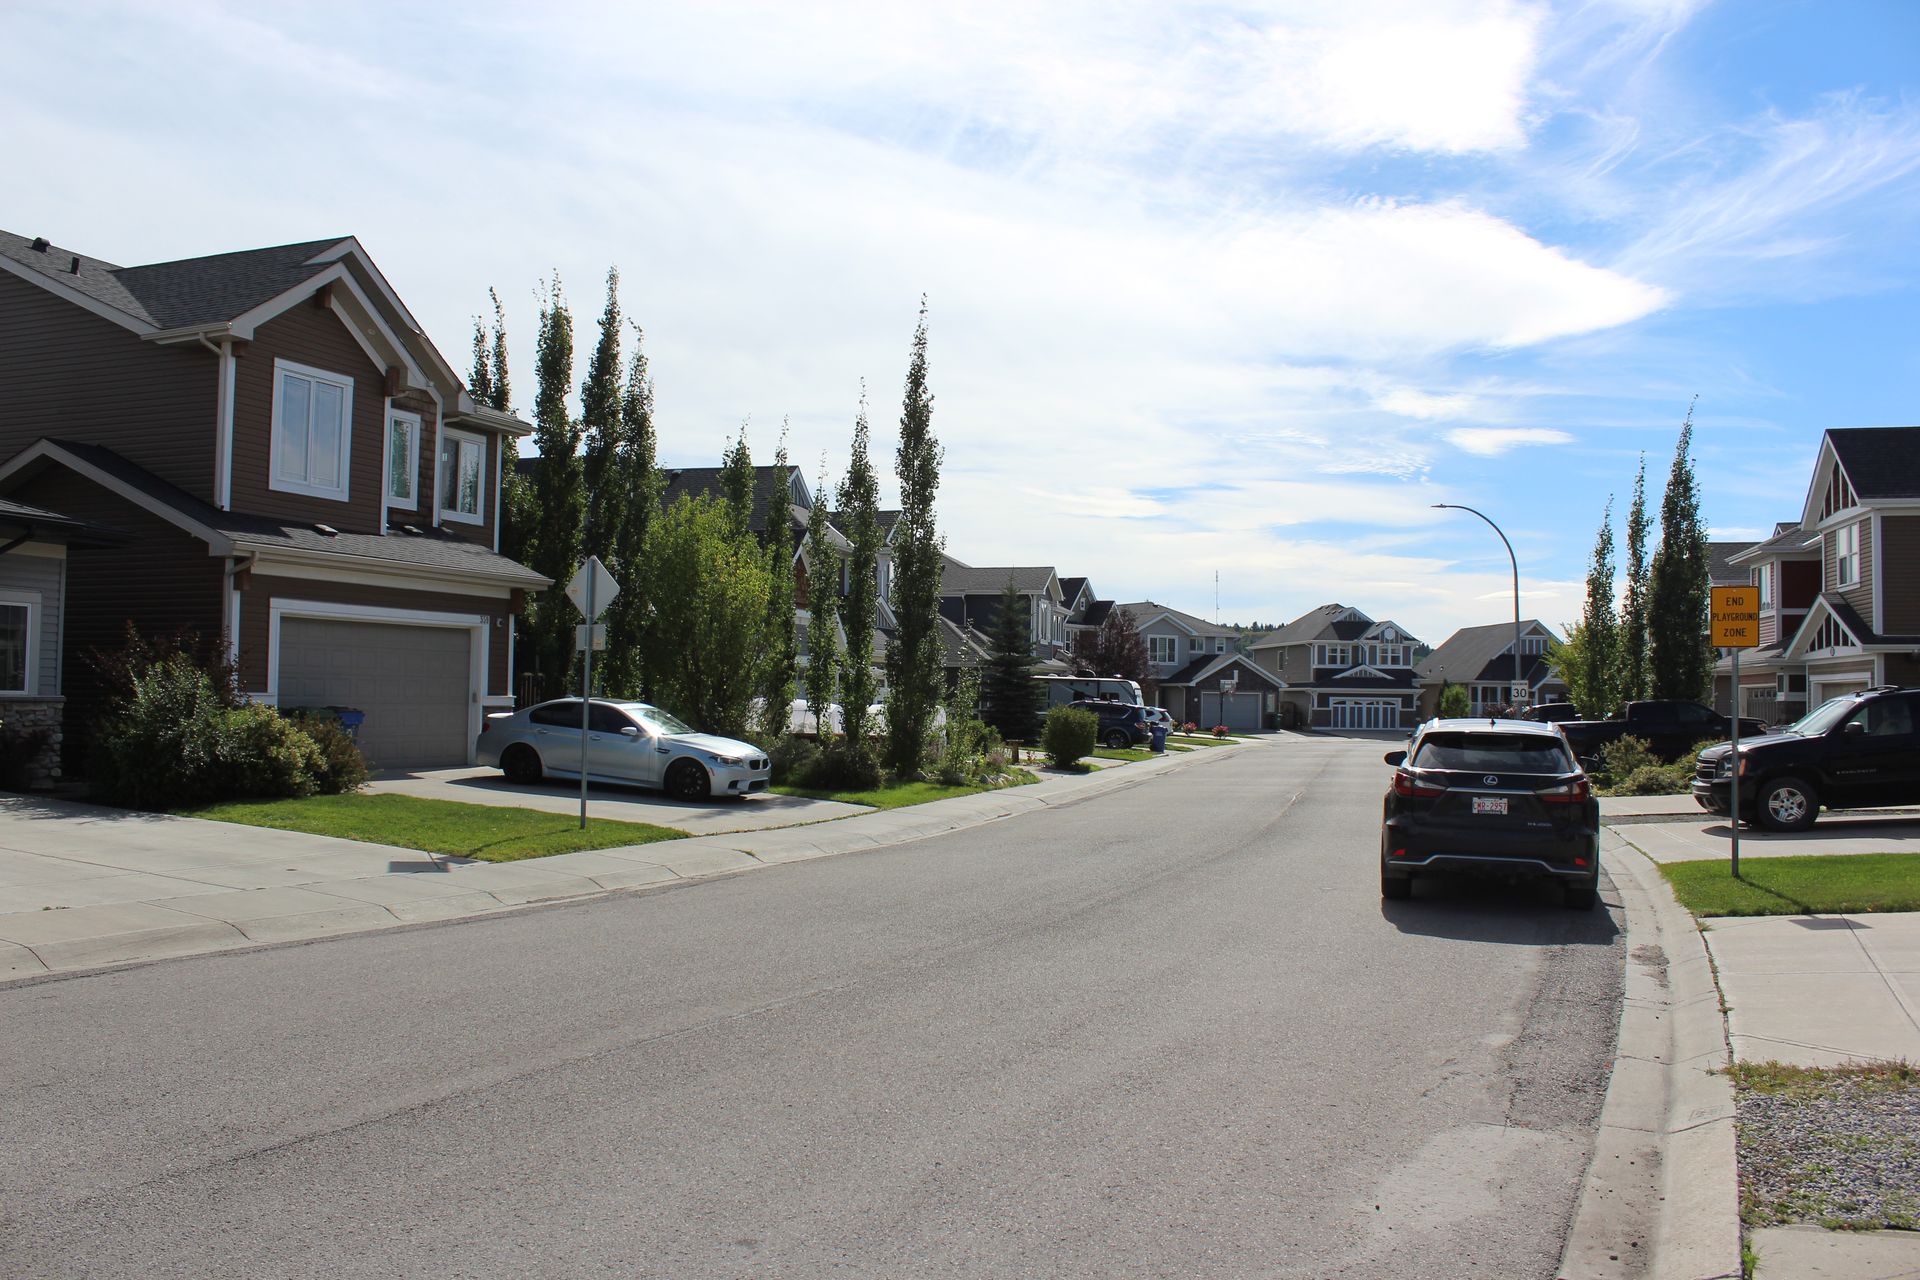
Welcome to my brief overview about the latest real estate statistics from 2023 in our town of Cochrane, AB. Nestled at the edge of the mountains, Cochrane boasts a thriving real estate market with an array of enticing opportunities for homebuyers and investors alike.
In this overview, I provide a quick look at the Cochrane real estate market, offering you insights into property values and average days on market, depending on area. Property values have been holding up very well and with the diverse range of Cochrane homes for sale, 2024 should follow suit. Whether you're a prospective buyer, seller, or simply curious about the real estate scene in Cochrane, take a look at the statistics that have shaped the housing market in our growing town. Let's navigate the numbers and discover the exciting potential that Cochrane's real estate market has to offer!
*Please note – as Cochrane is continually growing, many of our newer neighbourhoods present opportunities to design and build directly with builders. The numbers below do not include sales completed directly with a builder.
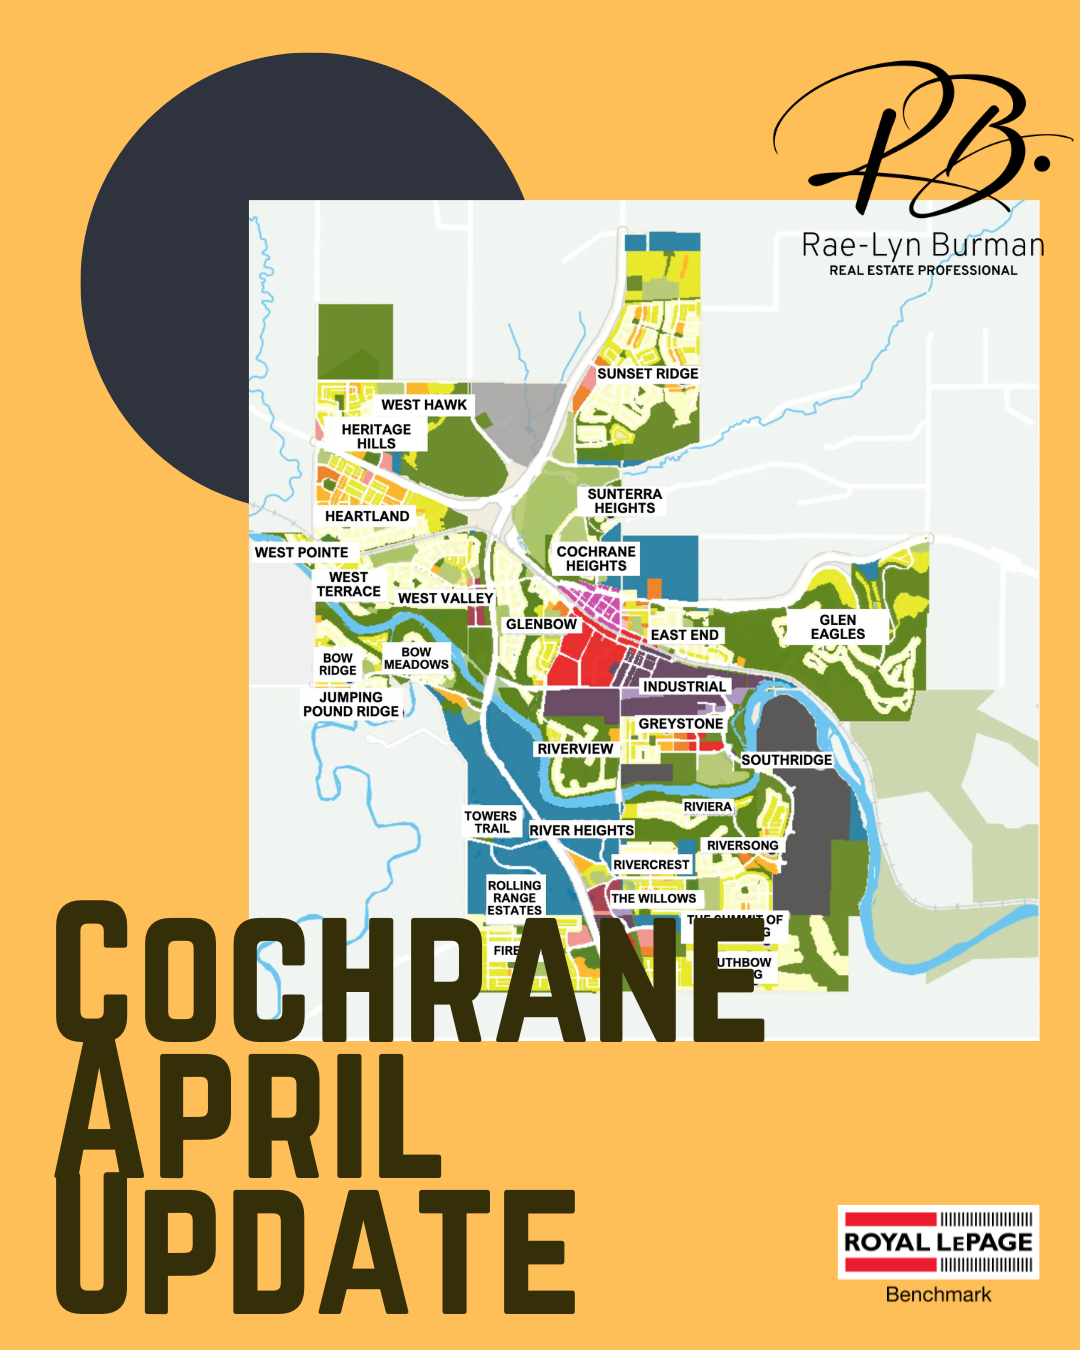
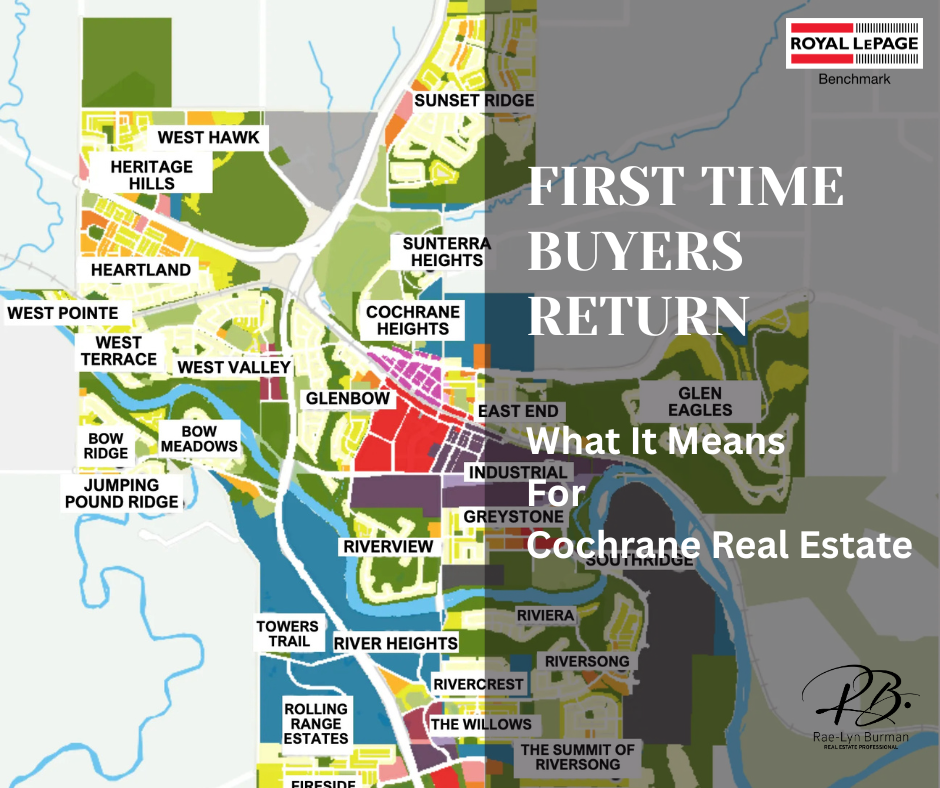
*Neighbourhoods listed alphabetically
BOW MEADOWS
- Sold - 10
- Average sale price – $605,365
- Average price per sqft - $369.24
- Average DOM – 18
- Average list price – $604,850
- Average sale price vs list price – 99.33%
BOW RIDGE
- Sold - 22
- Average sale price – $580,436
- Average price per sqft - $375.27
- Average DOM – 25
- Average list price – $581,041
- Average sale price vs list price – 100.10%
COCHRANE HEIGHTS/ SUNTERRA HEIGHTS
- Sold - 9
- Average sale price – $549,862
- Average price per sqft - $401.19
- Average DOM – 30
- Average list price – $558,078
- Average sale price vs list price – 99.58%
DOWNTOWN
- Sold - 14
- Average sale price – $284,929
- Average price per sqft - $318.53
- Average DOM – 17
- Average list price – $283,421
- Average sale price vs list price – 101.10%
EAST END
- Sold - 36
- Average sale price – $413,090
- Average price per sqft - $375.49
- Average DOM – 37
- Average list price – $417,308
- Average sale price vs list price – 99.17%
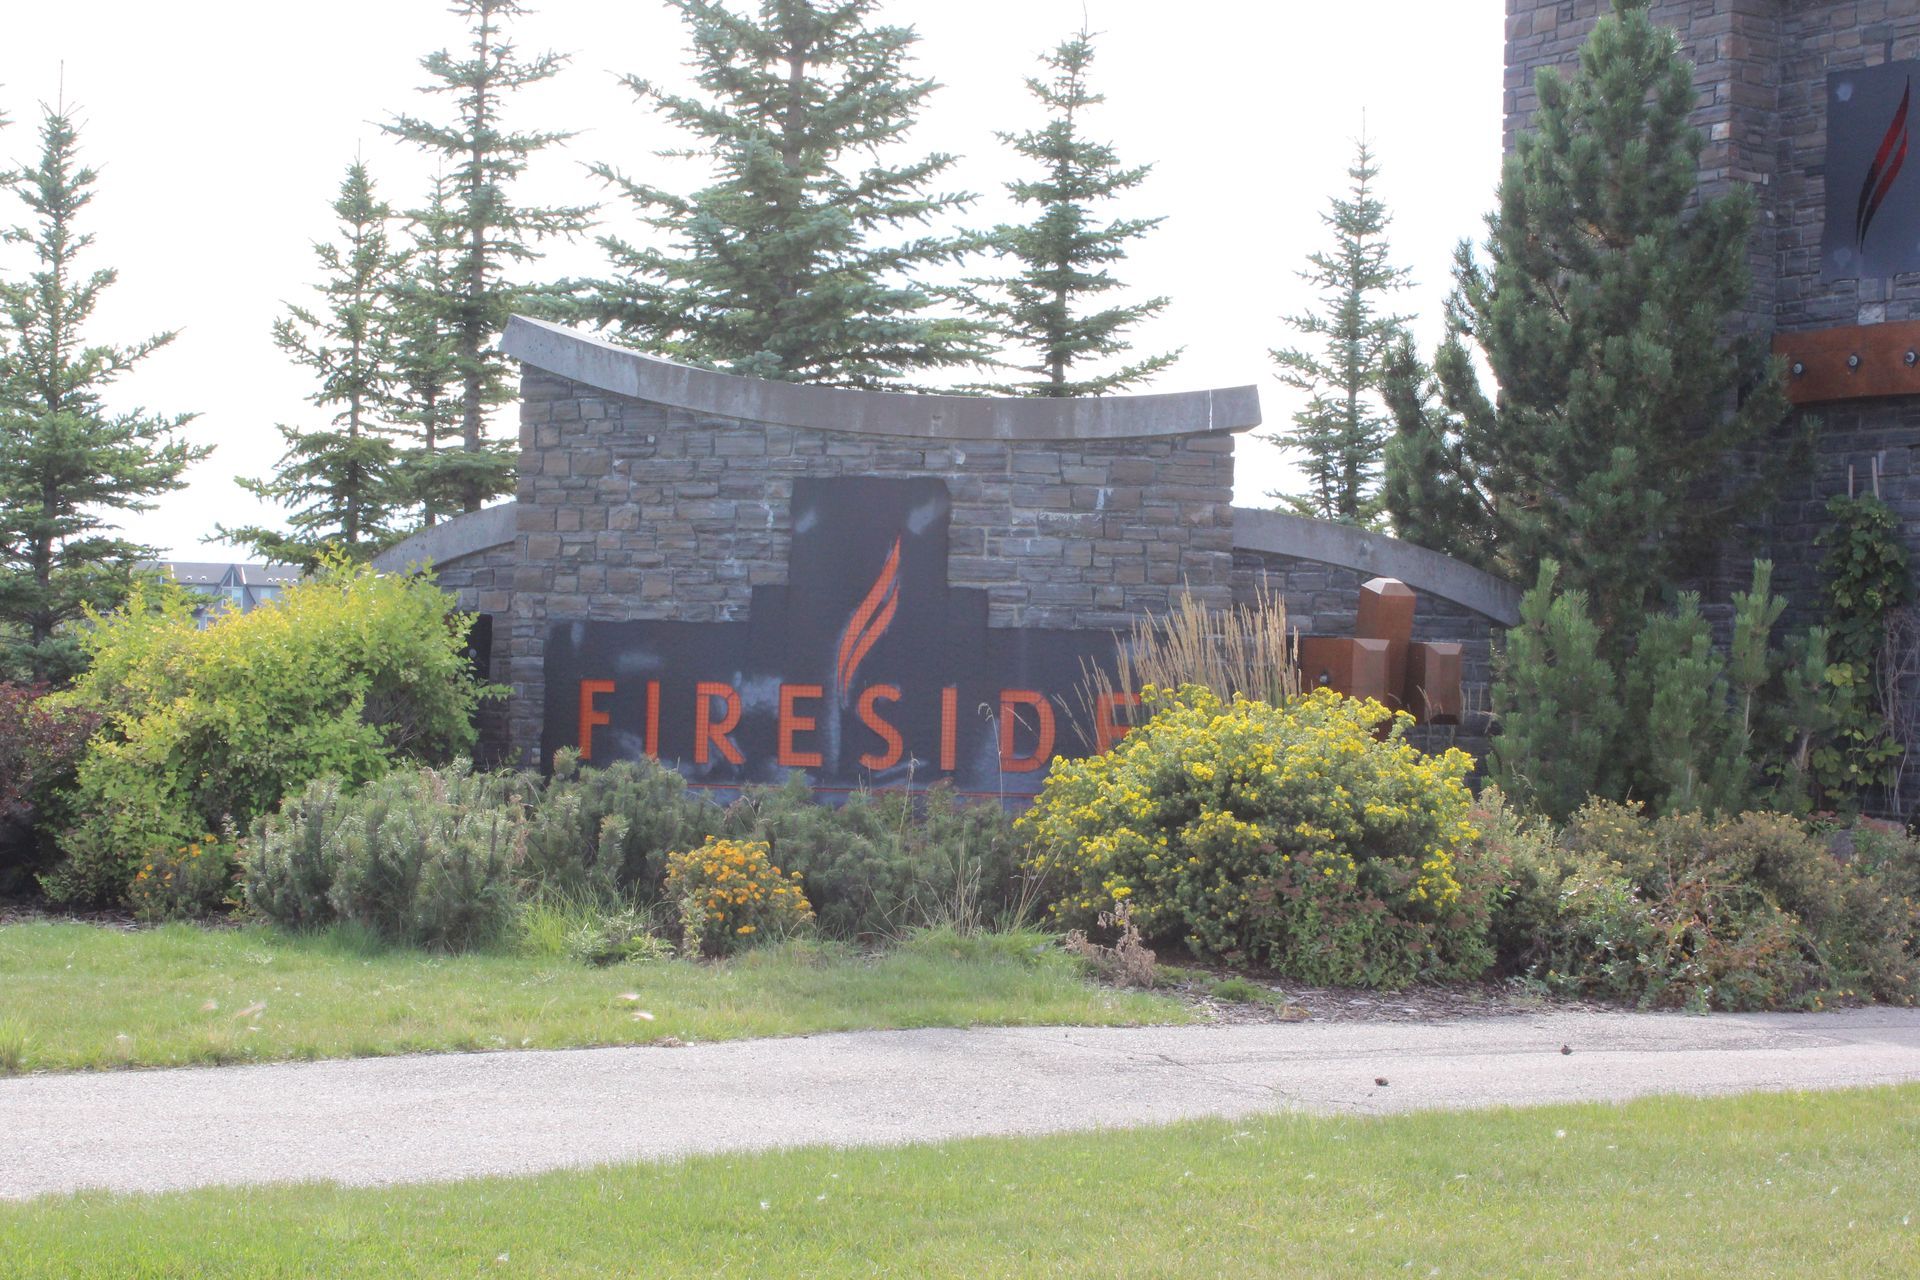
FIRESIDE
- Sold – 83
- Average sale price – $513,525
- Average price per sqft - $356.64
- Average DOM – 44
- Average list price – $518,521
- Average sale price vs list price – 99.07%
GLENBOW
- Sold - 32
- Average sale price – $404,043
- Average price per sqft - $387.38
- Average DOM – 25
- Average list price – $407,519
- Average sale price vs list price – 99.48%
GLENEAGLES
- Sold - 53
- Average sale price – $756,388
- Average price per sqft - $434.95
- Average DOM – 38
- Average list price – $766,777
- Average sale price vs list price – 98.81%
GREYSTONE
- Sold - 21
- Average sale price – $533,384
- Average price per sqft - $363.21
- Average DOM – 58
- Average list price – $537,448
- Average sale price vs list price – 99.39%
HEARTLAND
- Sold - 96
- Average sale price – $525,905
- Average price per sqft - $311.92
- Average DOM – 34
- Average list price – $529,002
- Average sale price vs list price – 99.54%
HERITAGE HILLS
- Sold - 66
- Average sale price – $544,831
- Average price per sqft - $327.79
- Average DOM – 33
- Average list price – $546,704
- Average sale price vs list price – 99.76%
JUMPING POUND RIDGE
- Sold - 31
- Average sale price – $468,468
- Average price per sqft - $
- Average DOM – 32
- Average list price – $472,284
- Average sale price vs list price – 99.27%
RIVER HEIGHTS
- Sold - 26
- Average sale price – $593,535
- Average price per sqft - $433.15
- Average DOM – 29
- Average list price – $597,334
- Average sale price vs list price – 99.26%
RIVER SONG/RIVIERA/PRECEDENCE
- Sold - 95
- Average sale price – $654,443
- Average price per sqft - $357.60
- Average DOM – 45
- Average list price – $659,041
- Average sale price vs list price – 99.41%
RIVERCREST
- Sold - 14
- Average sale price – $627,371
- Average price per sqft - $348.07
- Average DOM – 80
- Average list price – $633,032
- Average sale price vs list price – 99.16%
RIVERVIEW
- Sold - 18
- Average sale price – $602,238
- Average price per sqft - $390.34
- Average DOM – 32
- Average list price – $608,028
- Average sale price vs list price – 99.05%
SUNSET RIDGE
- Sold - 183
- Average sale price – $515,794
- Average price per sqft - $332.56
- Average DOM – 36
- Average list price – $520,026
- Average sale price vs list price – 99.22%
THE WILLOWS
- Sold – 43
- Average sale price – $546,819
- Average price per sqft - $341.70
- Average DOM – 44
- Average list price – $552,722
- Average sale price vs list price – 98.96%
WEST POINTE
- Sold - 5
- Average sale price – $683,600
- Average price per sqft - $357.75
- Average DOM – 67
- Average list price – $699,560
- Average sale price vs list price – 98.53%
WEST TERRACE
- Sold - 21
- Average sale price – $525,953
- Average price per sqft - $371.59
- Average DOM – 16
- Average list price – $525,490
- Average sale price vs list price – 100.14%
WEST VALLEY
- Sold - 24
- Average sale price – $519,975
- Average price per sqft - $434.51
- Average DOM – 19
- Average list price – $519,067
- Average sale price vs list price – 100.27%
So, as I wrap up our exploration of Cochrane real estate statistics in 2023, it's evident that this town offers a variety of housing options and a dynamic market. Whether you're looking to buy or sell, understanding these numbers can help you navigate the real estate landscape more effectively.
As the real estate scene in Cochrane continues to evolve, being aware of these trends empowers you to make informed decisions. The market dynamics, combined with Cochrane's enduring appeal, present interesting opportunities for those interested in real estate. From older neighbourhoods to newer developments, Cochrane offers a wide spectrum of choices for potential homeowners catering to different preferences and budgets.
As you delve into the facts and figures, may this brief overview assist you in making sound decisions on your real estate journey in Cochrane. Here's to navigating the numbers and finding your place in this dynamic market!
Source: Pillar9/residential/sold/01/01/2023-12/31/2023/Cochrane/subdivisionname
Cochrane Real Estate Resources