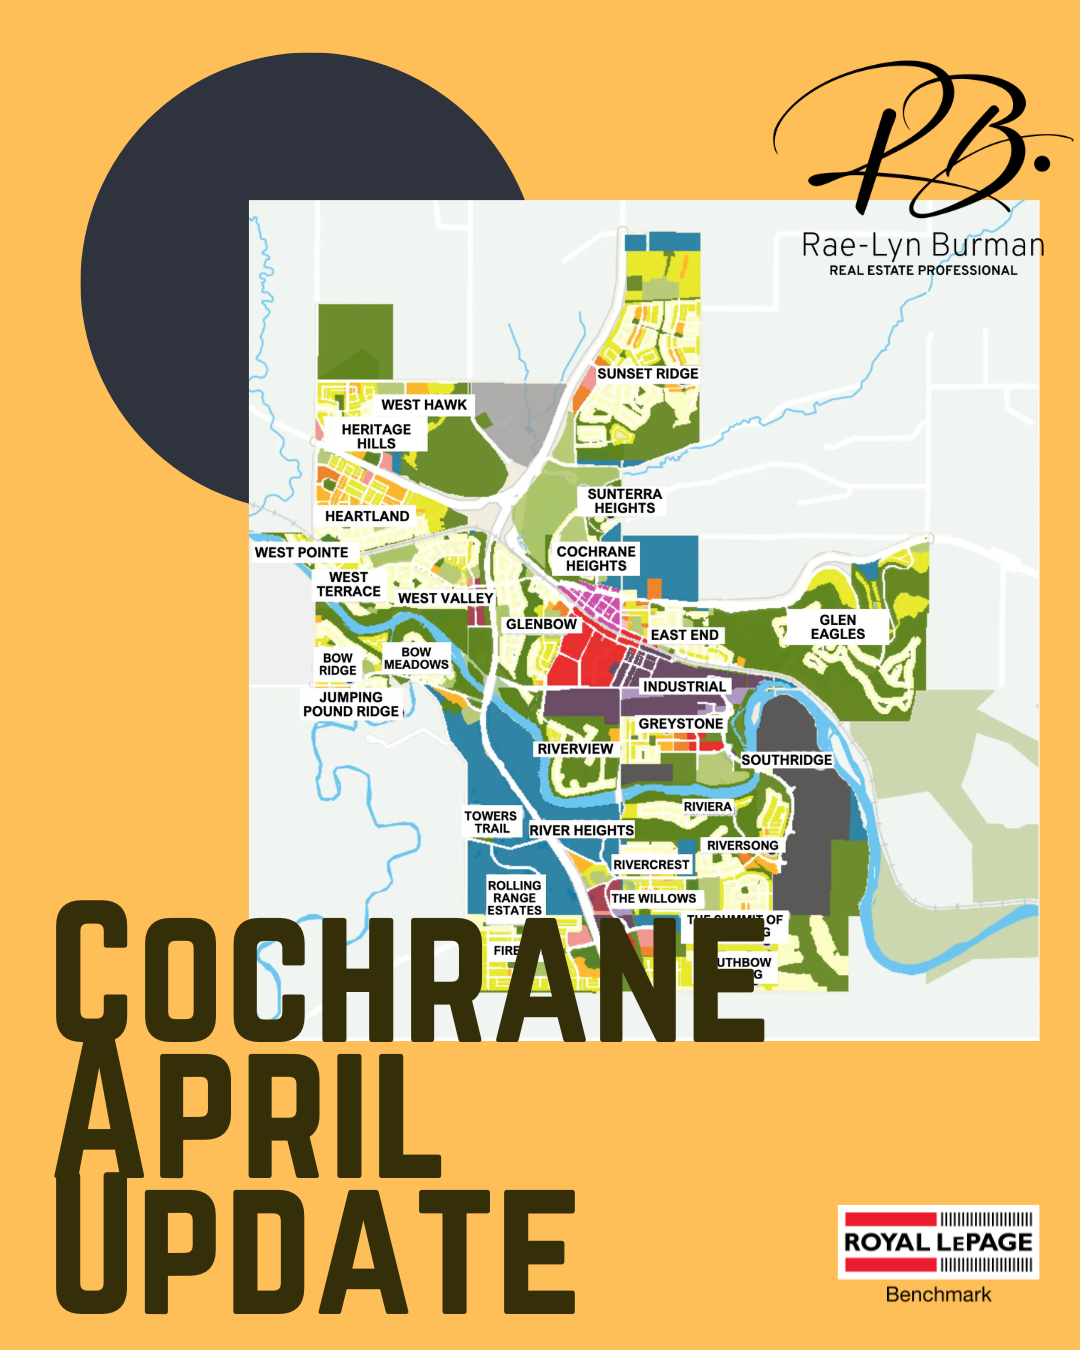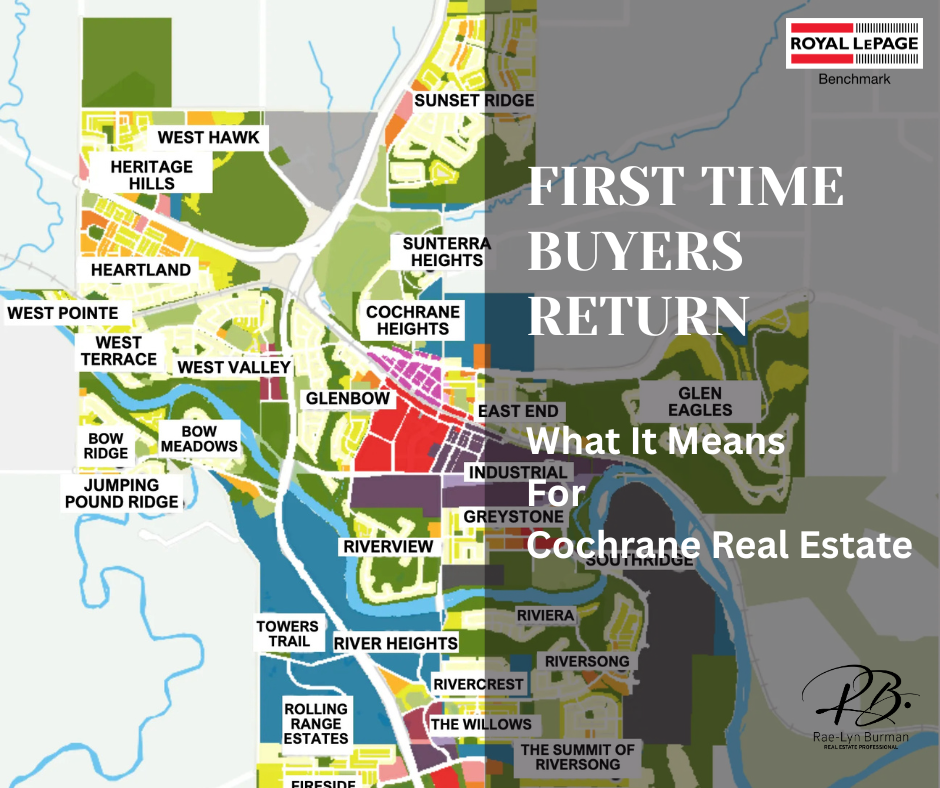
Cochrane Neighbourhood Real Estate Stats From 2024
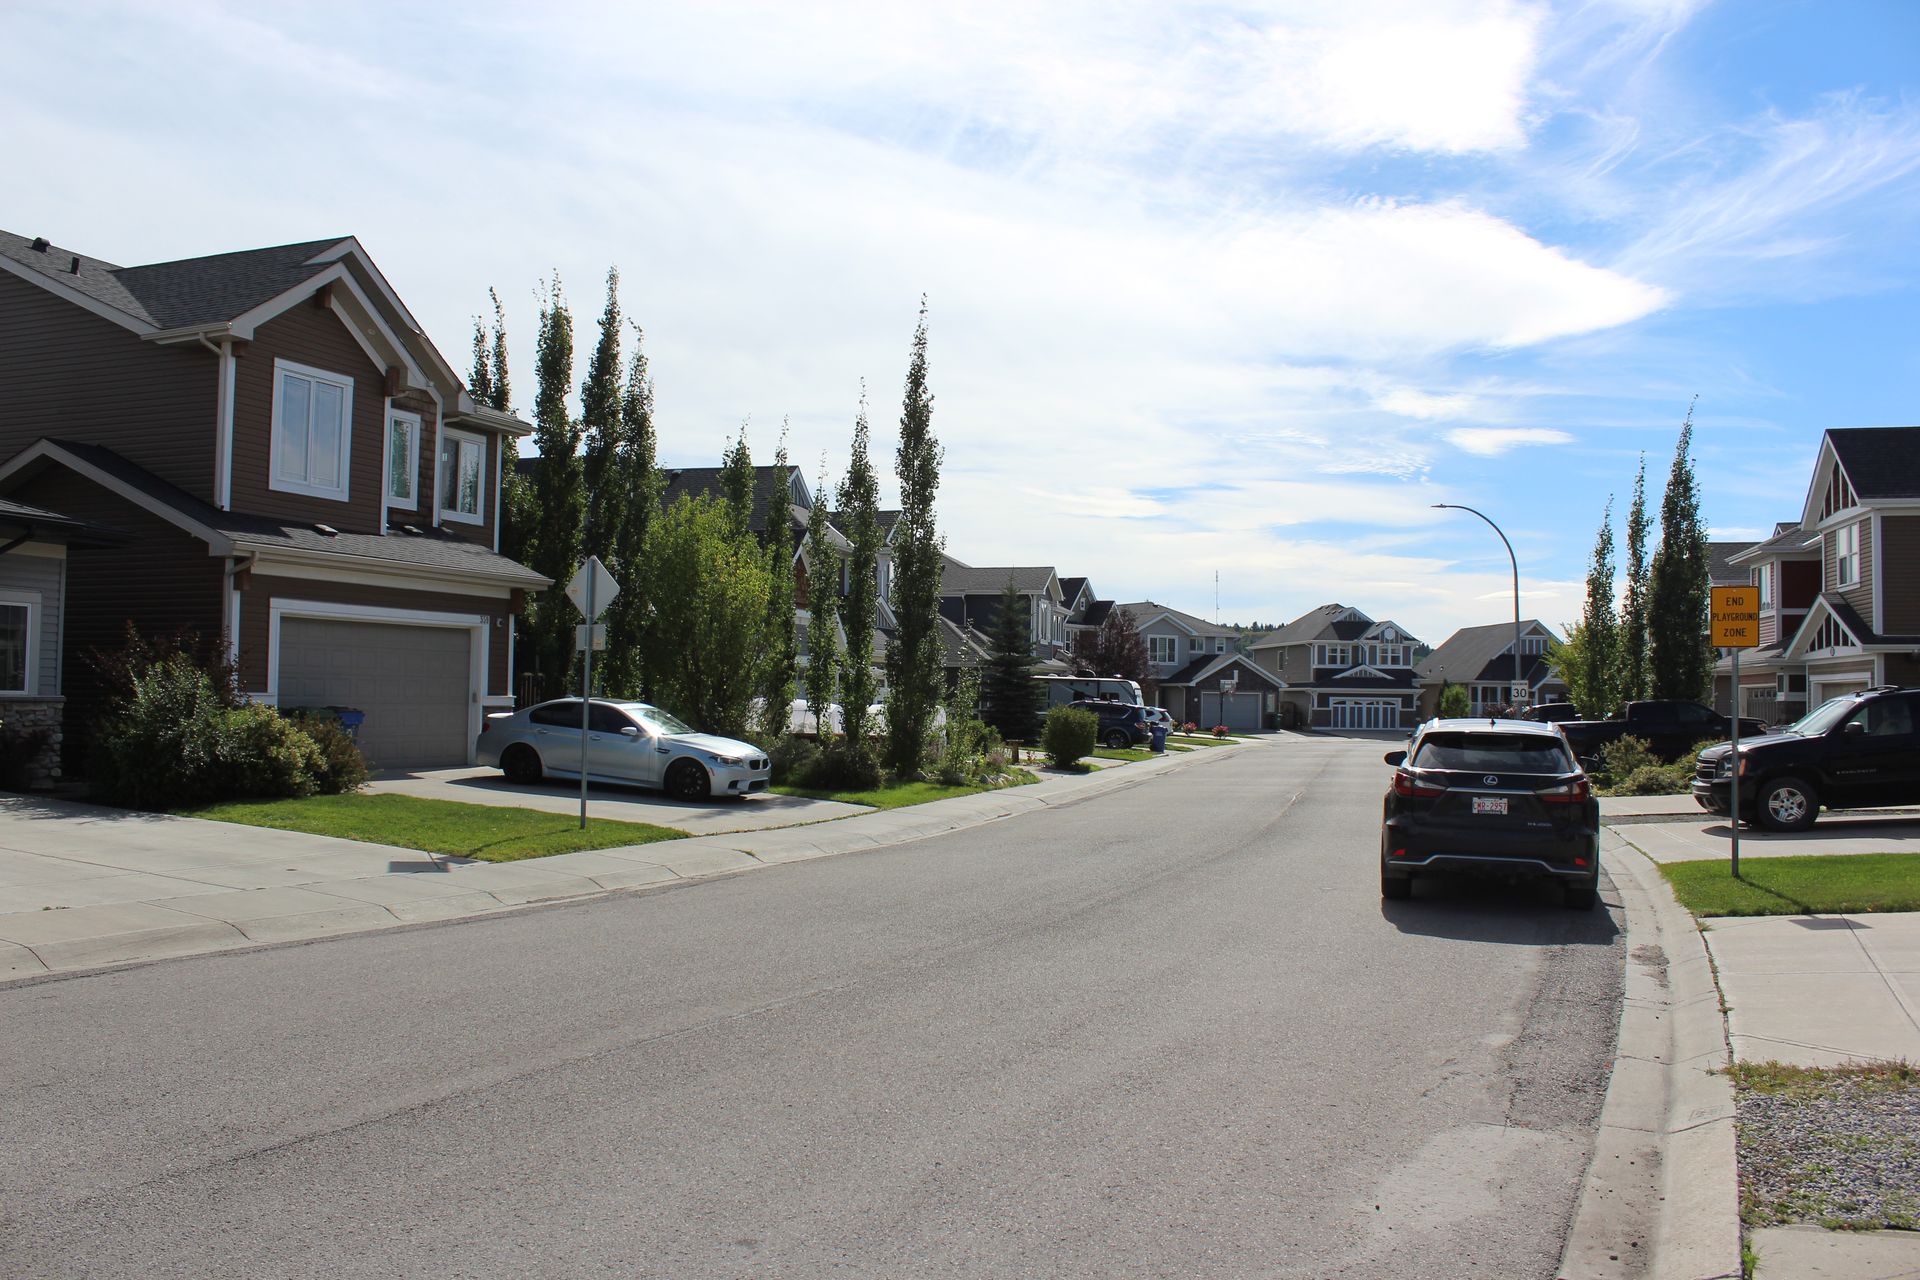
Here’s a quick look at the latest 2024 real estate statistics for Cochrane, AB. Located at the gateway to the mountains, Cochrane offers a dynamic real estate market with great opportunities for homebuyers and investors alike.
This summary highlights key details about property values and average days on the market by area. Property values remain strong, and with a wide range of homes available, 2025 is shaping up to be just as promising. Whether you’re looking to buy, sell, or simply stay informed about Cochrane’s housing trends, this data provides valuable insights into our town’s growing real estate market. Let’s take a closer look at the numbers and explore what Cochrane's Real Estate has to offer!
| Bow Ridge | |
|---|---|
| # of Solds | 21 |
| av. Sold $ | 533,838 |
| av. $/sqft | 353.23 |
| av. DOM | 21 |
| av. List $ | 535,514 |
| av. Sale $ vs list $ | 99.78% |
| Cochrane Heights/Sunterra | |
|---|---|
| # of Solds | 16 |
| av. Sold $ | 701,655 |
| av. $/sqft | 457.56 |
| av. DOM | 26 |
| av. List $ | 718,487 |
| av. Sale $ vs list $ | 97.66% |
| Downtown | |
|---|---|
| # of Solds | 15 |
| av. Sold $ | 361,430 |
| av. $/sqft | 392.14 |
| av. DOM | 22 |
| av. List $ | 360,600 |
| av. Sale $ vs list $ | 100.6% |
| East End | |
|---|---|
| # of Solds | 23 |
| av. Sold $ | 481.052 |
| av. $/sqft | 445.48 |
| av. DOM | 34 |
| av. List $ | 481,756 |
| av. Sale $ vs list $ | 100.8% |
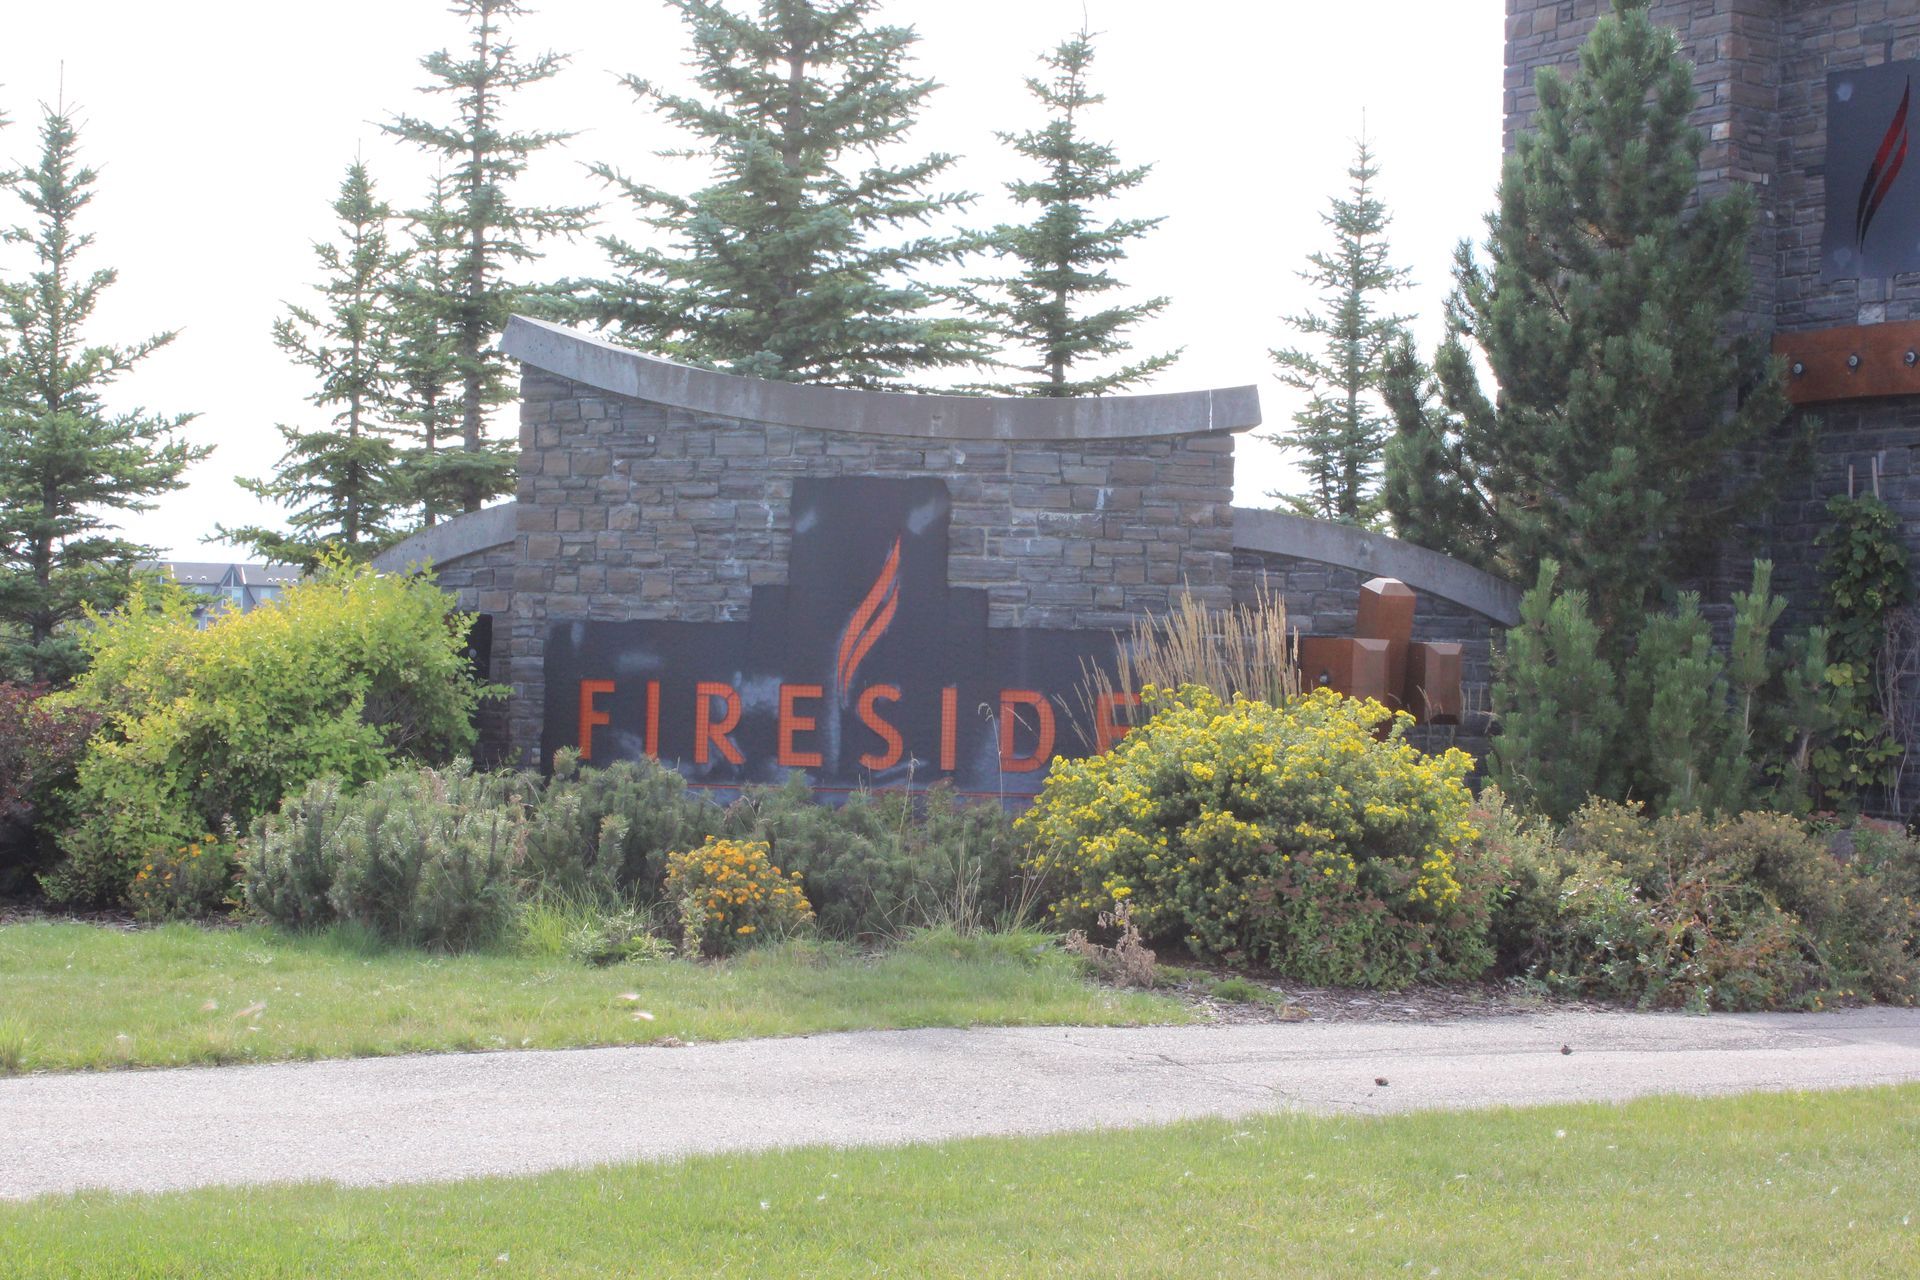
| Fireside | |
|---|---|
| # of Solds | 116 |
| av. Sold $ | 545,674 |
| av. $/sqft | 368.52 |
| av. DOM | 36 |
| av. List $ | 549,495 |
| av. Sale $ vs list $ | 99.34% |
| Glenbow | |
|---|---|
| # of Solds | 34 |
| av. Sold $ | 389,894 |
| av. $/sqft | 383.69 |
| av. DOM | 20 |
| av. List $ | 389,650 |
| av. Sale $ vs list $ | 100.29% |
| Gleneagles | |
|---|---|
| # of Solds | 36 |
| av. Sold $ | 863,014 |
| av. $/sqft | 482.58 |
| av. DOM | 26 |
| av. List $ | 865,819 |
| av. Sale $ vs list $ | 99.69% |
| Greystone | |
|---|---|
| # of Solds | 35 |
| av. Sold $ | 576,324 |
| av. $/sqft | 362 |
| av. DOM | 57 |
| av. List $ | 575,486 |
| av. Sale $ vs list $ | 100.19% |
| Heartland | |
|---|---|
| # of Solds | 131 |
| av. Sold $ | 576,771 |
| av. $/sqft | 337.2 |
| av. DOM | 38 |
| av. List $ | 578,037 |
| av. Sale $ vs list $ | 99.96% |
| Heritage Hills | |
|---|---|
| # of Solds | 82 |
| av. Sold $ | 617,625 |
| av. $/sqft | 337.5 |
| av. DOM | 33 |
| av. List $ | 621,549 |
| av. Sale $ vs list $ | 99.45% |
| Jumping Pound Ridge | |
|---|---|
| # of Solds | 20 |
| av. Sold $ | 558,285 |
| av. $/sqft | 328.03 |
| av. DOM | 32 |
| av. List $ | 562,175 |
| av. Sale $ vs list $ | 99.21% |
| River Heights | |
|---|---|
| # of Solds | 16 |
| av. Sold $ | 555,447 |
| av. $/sqft | 370.51 |
| av. DOM | 17 |
| av. List $ | 549,681 |
| av. Sale $ vs list $ | 101.54% |
| Riversong/Riviera/Prec | |
|---|---|
| # of Solds | 83 |
| av. Sold $ | 706,157 |
| av. $/sqft | 364.4 |
| av. DOM | 34 |
| av. List $ | 711,622 |
| av. Sale $ vs list $ | 99.40% |
| Rivercrest | |
|---|---|
| # of Solds | 20 |
| av. Sold $ | 716,743 |
| av. $/sqft | 357.54 |
| av. DOM | 36 |
| av. List $ | 723,277 |
| av. Sale $ vs list $ | 99.06% |
| Riverview | |
|---|---|
| # of Solds | 11 |
| av. Sold $ | 546,964 |
| av. $/sqft | 394.04 |
| av. DOM | 19 |
| av. List $ | 547,955 |
| av. Sale $ vs list $ | 99.93% |
| Sunset Ridge | |
|---|---|
| # of Solds | 208 |
| av. Sold $ | 568,755 |
| av. $/sqft | 364.72 |
| av. DOM | 31 |
| av. List $ | 569,092 |
| av. Sale $ vs list $ | 99.95% |
| The Willows | |
|---|---|
| # of Solds | 27 |
| av. Sold $ | 600,838 |
| av. $/sqft | 356.74 |
| av. DOM | 19 |
| av. List $ | 598,522 |
| av. Sale $ vs list $ | 100.54% |
| West Pointe | |
|---|---|
| # of Solds | 4 |
| av. Sold $ | 771,625 |
| av. $/sqft | 342.28 |
| av. DOM | 23 |
| av. List $ | 794,350 |
| av. Sale $ vs list $ | 97.78% |
| West Terrace | |
|---|---|
| # of Solds | 21 |
| av. Sold $ | 589,114 |
| av. $/sqft | 387.17 |
| av. DOM | 32 |
| av. List $ | 597,062 |
| av. Sale $ vs list $ | 98.89% |
| West Valley | |
|---|---|
| # of Solds | 28 |
| av. Sold $ | 557,855 |
| av. $/sqft | 468.35 |
| av. DOM | 21 |
| av. List $ | 558,664 |
| av. Sale $ vs list $ | 99.99% |
As we wrap up our review of Cochrane’s 2024 real estate statistics, it’s clear that this town offers a wide variety of housing options and a dynamic market. Whether you’re buying or selling, understanding these trends can help you make confident decisions.
Cochrane’s real estate market is always evolving, and staying informed allows you to navigate it more effectively. The town’s unique mix of market activity and lasting charm creates great opportunities for buyers and sellers alike. From established neighborhoods to new developments, Cochrane has options to fit different needs and budgets.
We hope this summary helps guide you on your real estate journey in Cochrane. Use these insights to make informed choices and find your place in this ever-changing market.
Source: Pillar9/residential/sold/01/01/2024-12/31/2024/Cochrane/subdivisionname
Cochrane Real Estate Resources